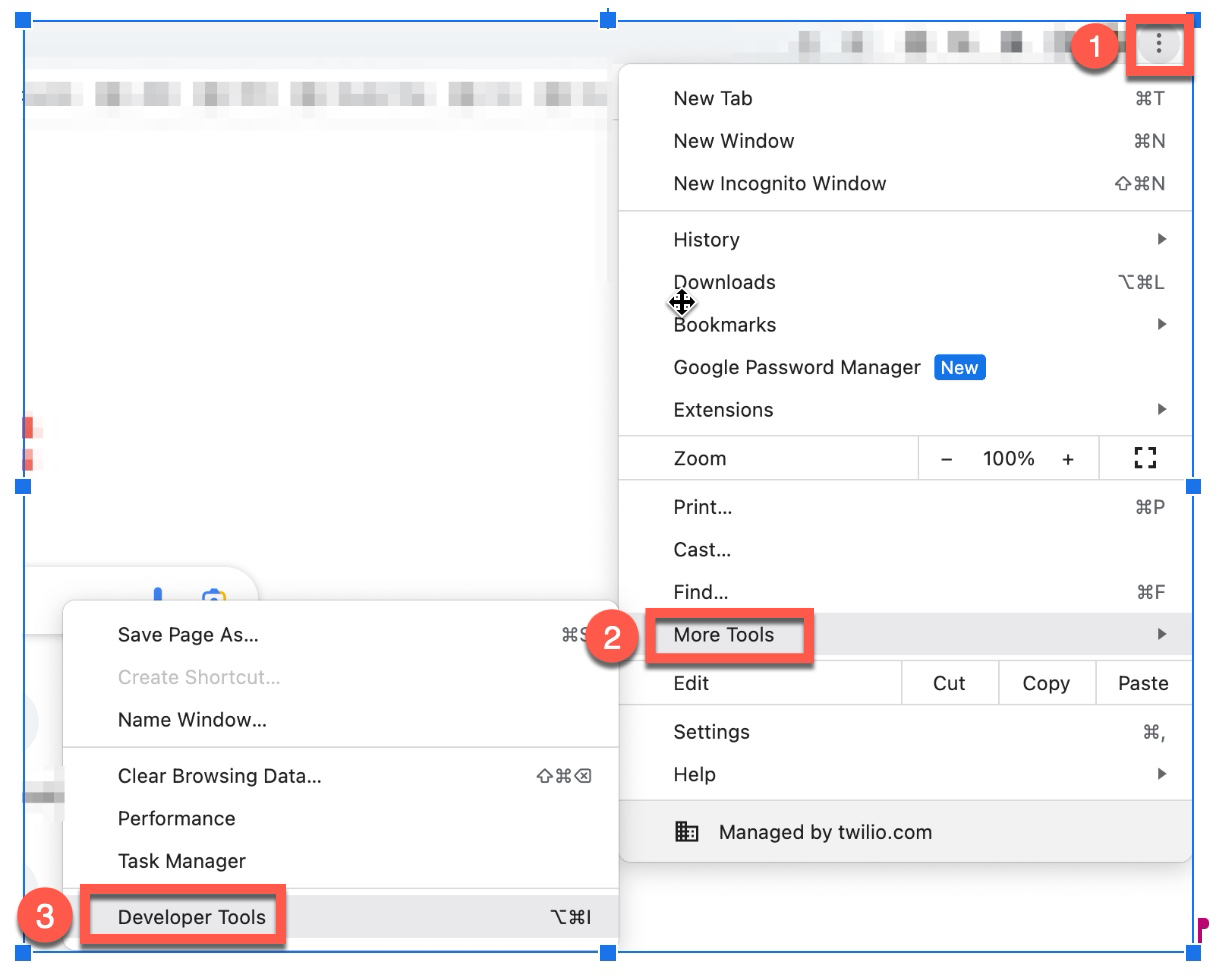
Step 1: Open the Chrome menu and navigate to Developer Tools. You can open Developer Tools with keyboard shortcuts or through the Chrome menu. The keyboard shortcuts are:
Windows: Ctrl+Shift+J
From the Chrome menu: Open the Chrome menu and go to More Tools > Developer Tools.
Step 2: Click on the settings icon in the upper right corner of the Developer Tools window
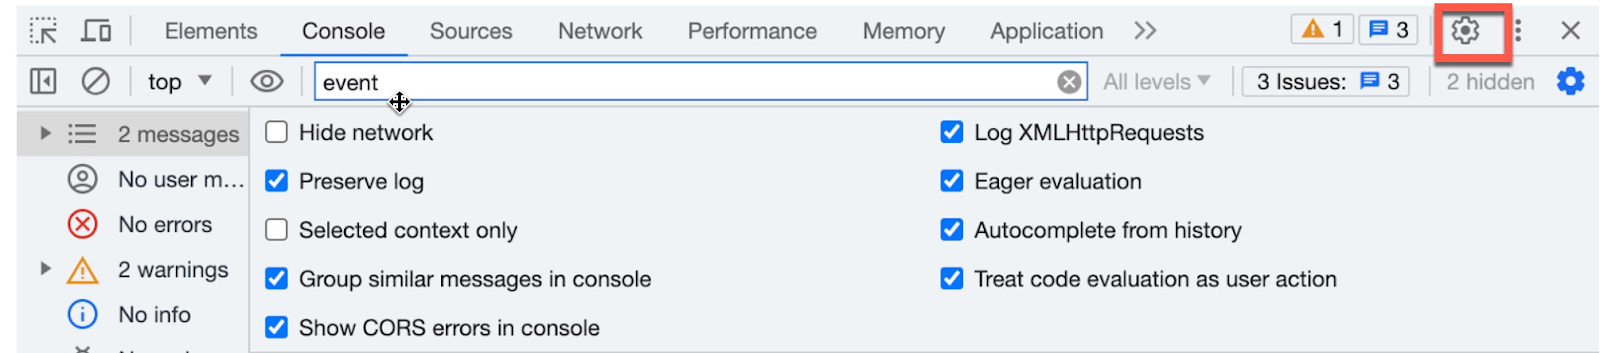
Step 3: Select the following checkboxes
Under Console
Log XMLHttpRequests
Show timestamps
Preserve log upon navigation
Under Network
Preserve log
Record network log
Step 4: Close the window
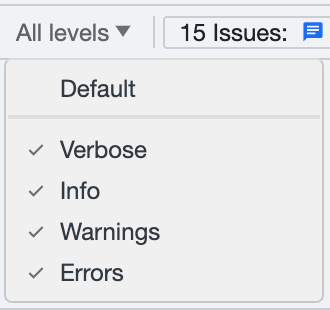
Step 5: To select a filter level on the Console tab, locate the Log level list at the top right corner of the window. Choose any filter level that is not currently selected. If you want to select all levels, the log level selection will display as All levels.
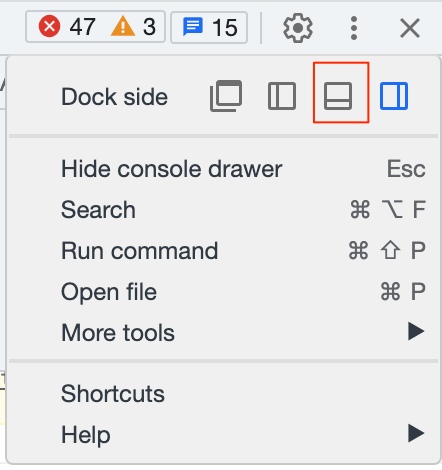
Step 6: To collect network logs during issue reproduction, select the menu and anchor the window at the bottom by selecting the icon with the smaller box on the bottom next to the Dock side option.
It's important to note that the network logs for the session will be lost if you close this window or the tab.
Step 7: Keep the console open and replicate the steps necessary to reproduce the issue being investigated
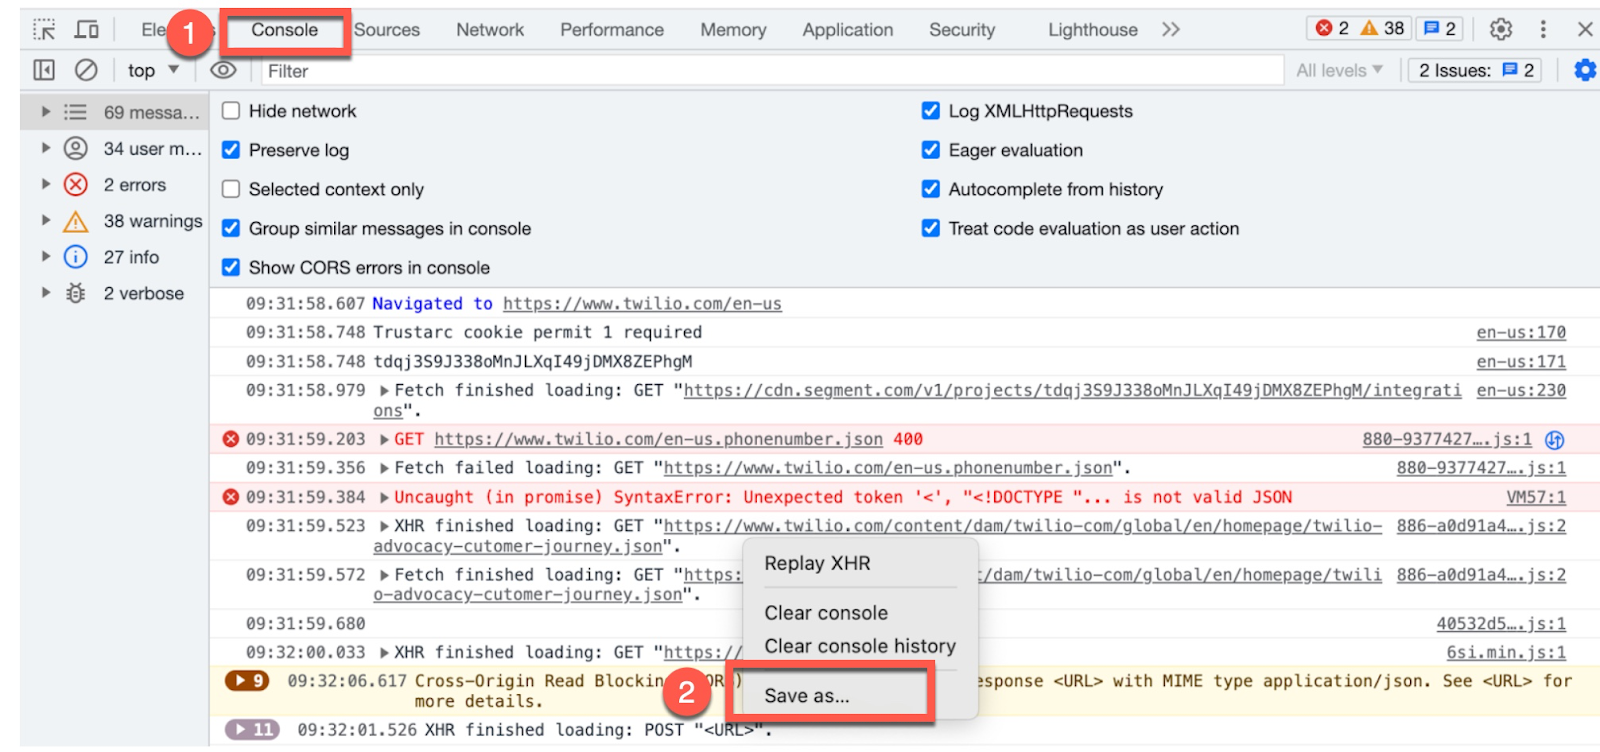
Step 8: After reproducing the issue, navigate to the console tab and gather the log files. Simply right-click on the log lines and select "Save As" to save them
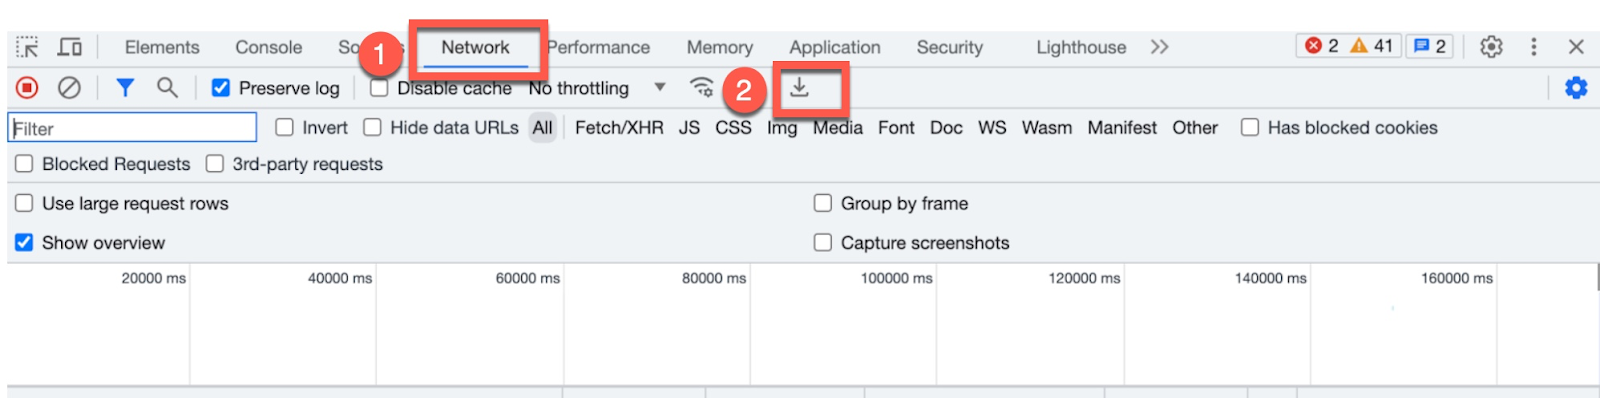
Step 9: Similarly, go to the Network tab and click on the export HAR icon (a download icon) to save the network logs
Step 10: Send the Console logs file and Network logs file to support@aselo.org
Was this article helpful?
That’s Great!
Thank you for your feedback
Sorry! We couldn't be helpful
Thank you for your feedback
Feedback sent
We appreciate your effort and will try to fix the article